CREATING DOCUMENTS WITH DYNAMIC DATA
NEOreporting is a tool designed to convert
a Word document with markup
to a document with charts, tables or data values.
It takes data from NEO reports with various custom options on how to present the data. NEOreporting is highly customisable and easy to use, create and publish Word documents.
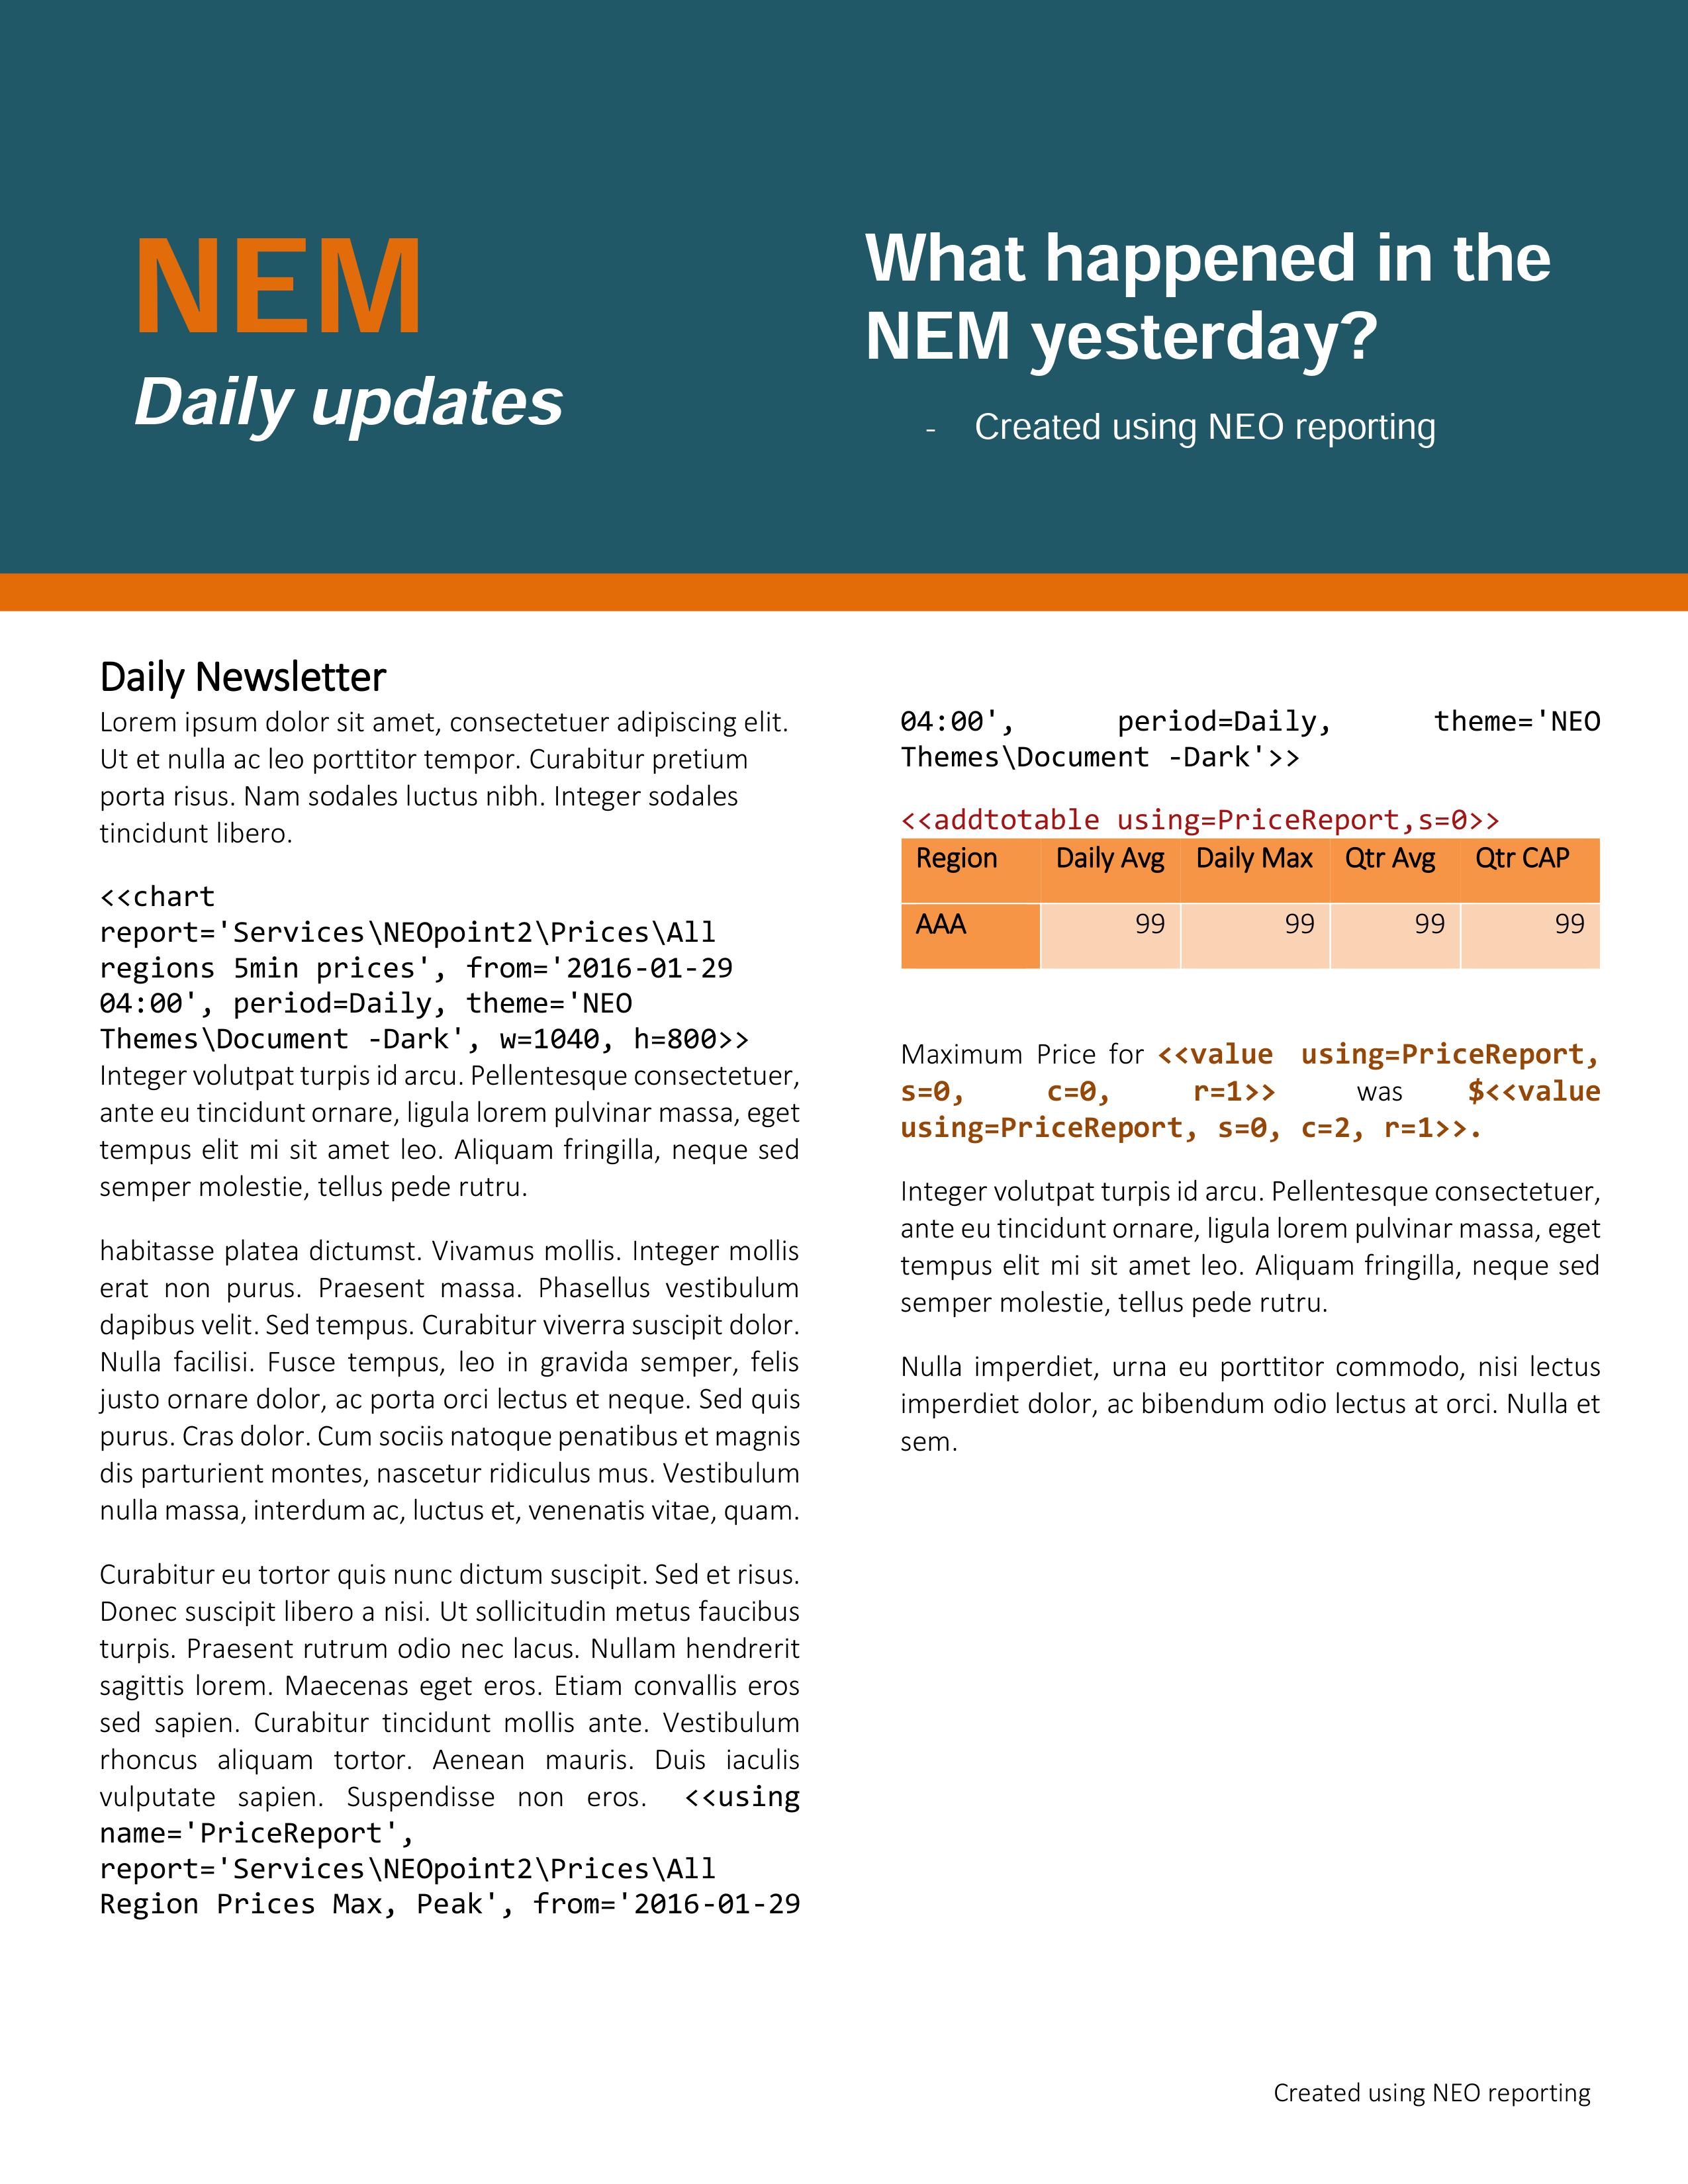
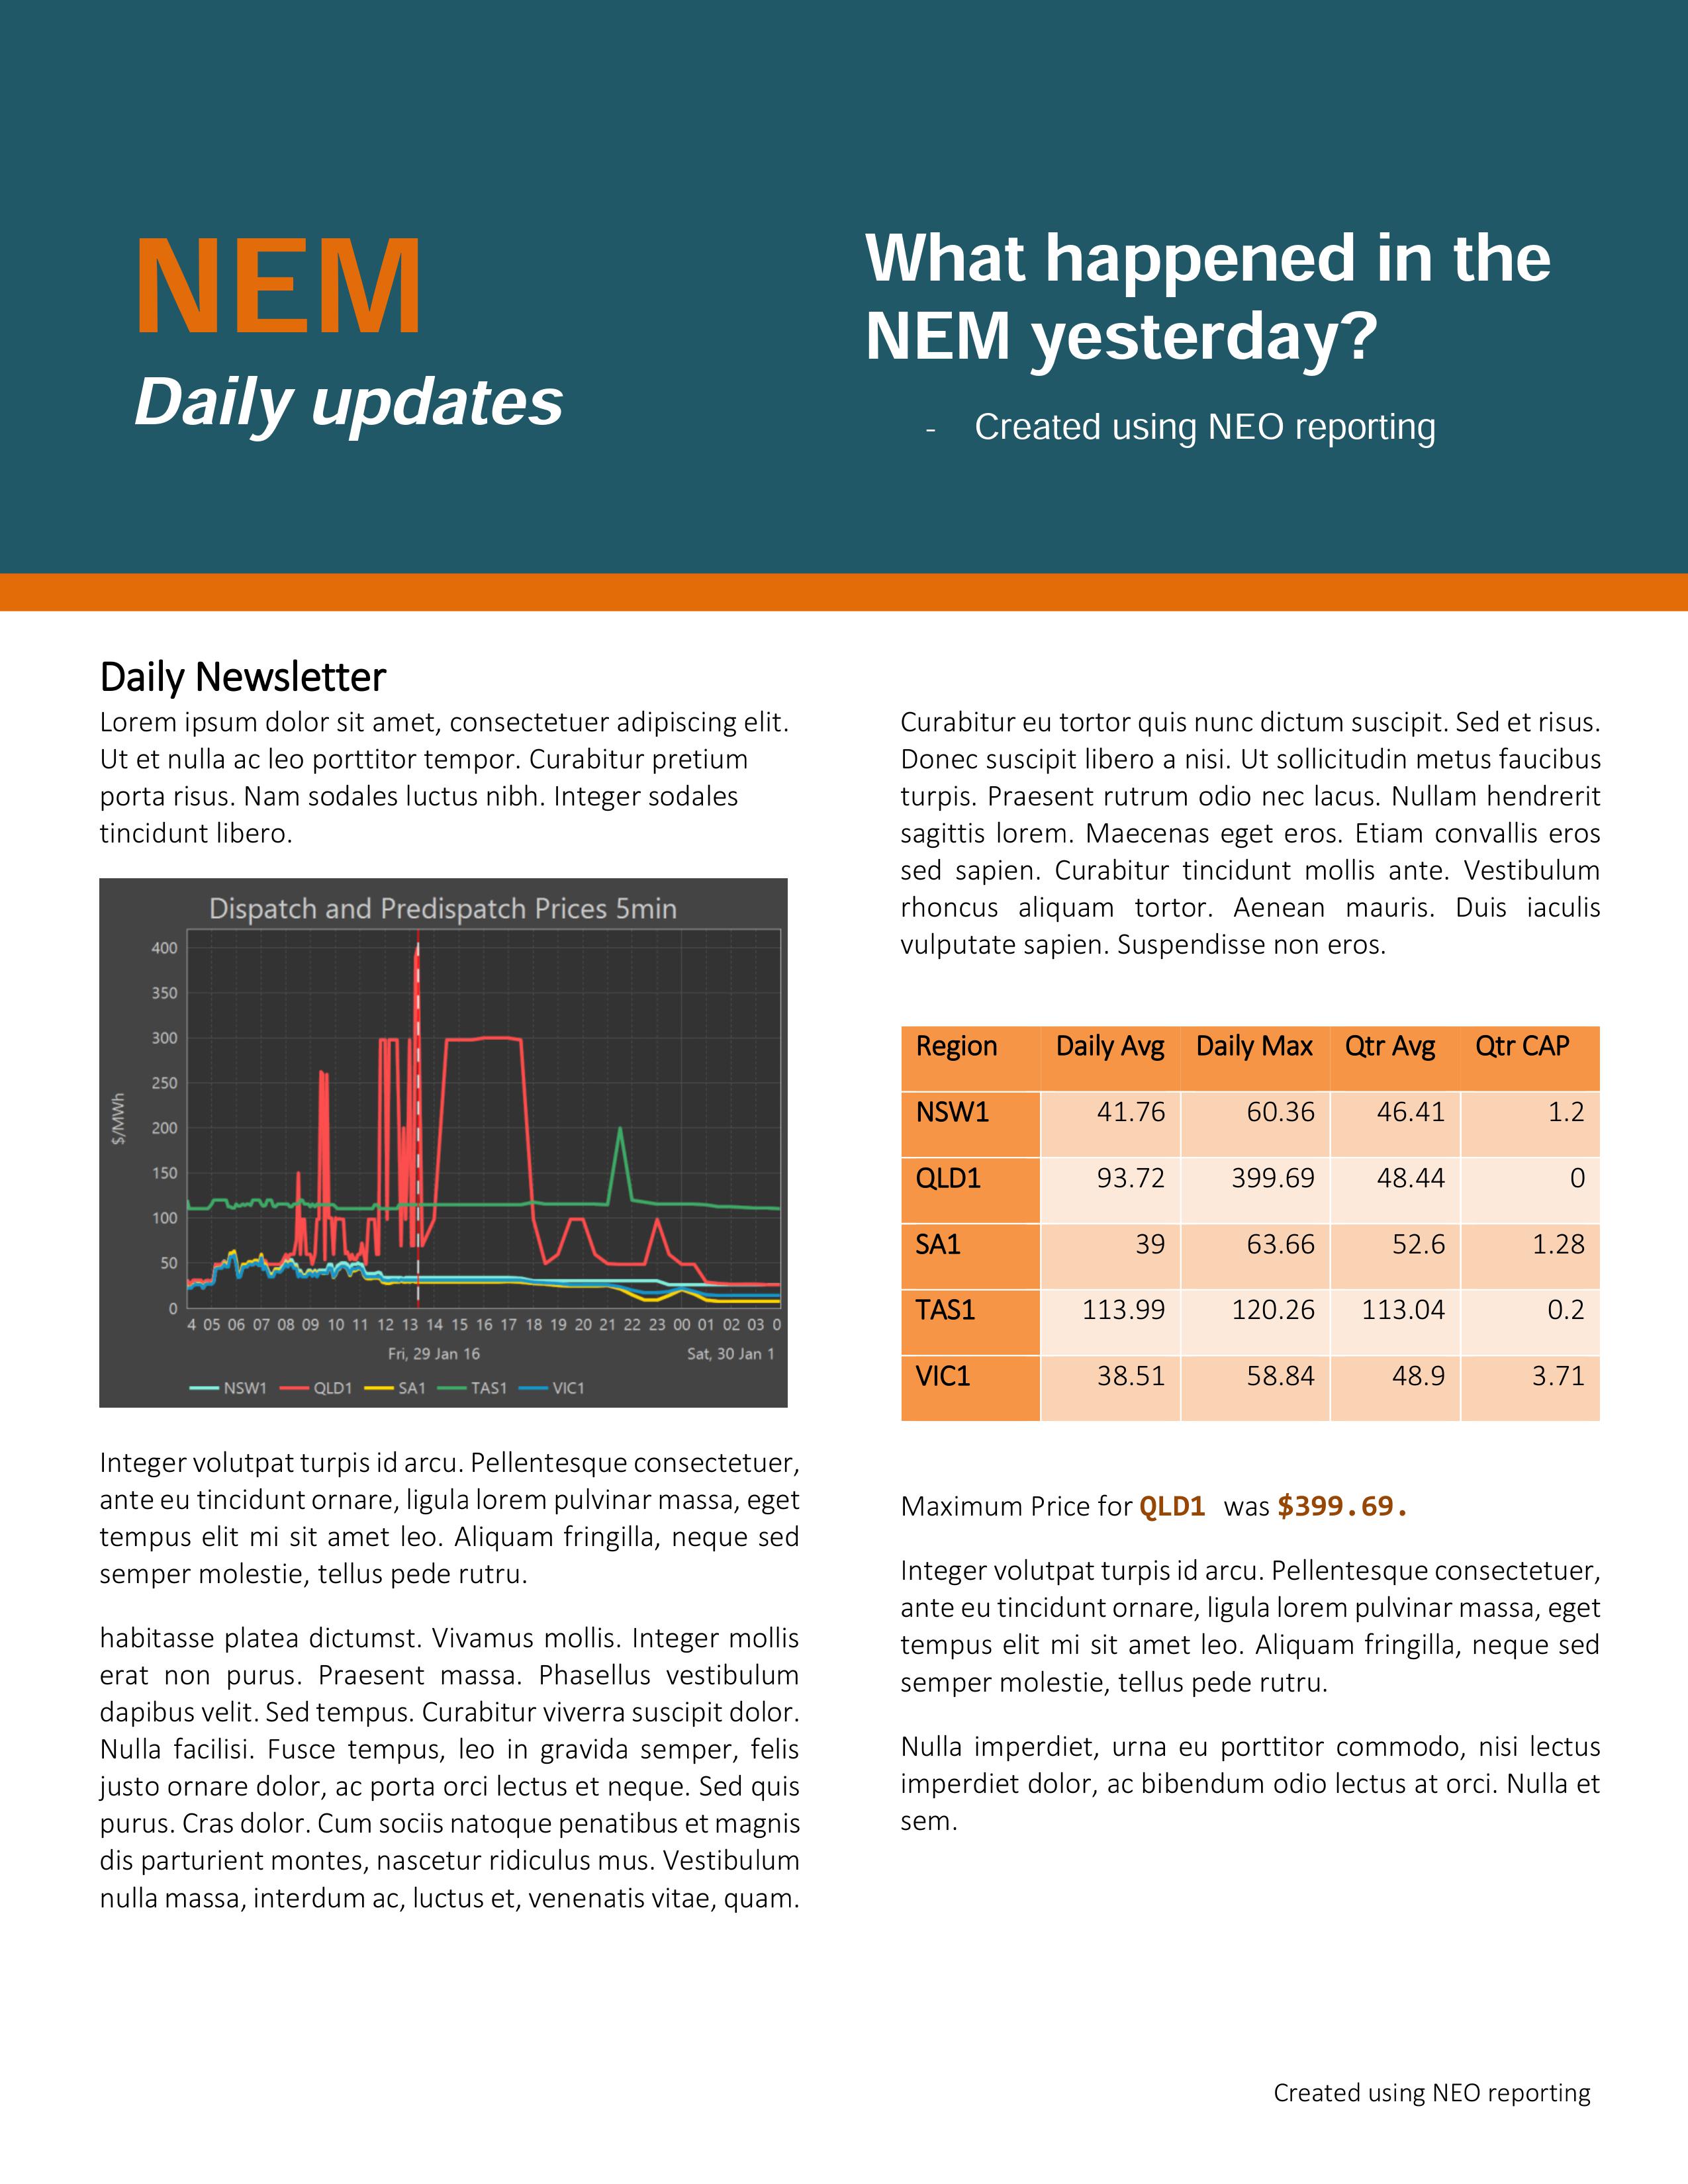
In the image on the left, you can see a sample Word document with markup specifying which NEO reports to run and what parameters to use and whether to insert as chart, table or value. In the image on the right, you can see the generated report
with the resulting chart, table and values.
Before - the template
After - the result
Create template using Microsoft Word.
Easily create templates with simple code tags.
Get information from your database, connected via NEO.
Create documents based on alerts or fixed schedule.
How does it work?
When a NEO reporting template is uploaded to NEO, the markup commands will be replaced by charts table or values as appropriate. All commands are contained within double arrows. The available commands are chart, table, addtotable, using and value. The way to run NEO Reporting is to either use:
- Main menu (top right) then Tools then NEO Reporting, then select the template file. The output will be written to the same file name but with _out appended to the name; or
- Add a “Document Run” object setting the template and output file names then double click on it to execute it.
- report - this is the path of the report to execute without the workspace or object type.
- from - the from date, e.g. 2010-01-21
- period - the period of the report from one of: FiveMins,ThirtyMins, ThreeHours, OneHour, Daily, TwoDays, ThreeDays, FourDays, FiveDays,Weekly, Fortnightly, Monthly, Quarterly, HalfYearly, Yearly, TwoYears.
- pc - this is a period code. It can be supplied instead of from and period. If both are supplied, period takes precedence.
- instances - this is a semi-colon separated list of step instances.
'Chart' command
The following are additional chart commands:
- w - width in pixels for chart to be rendered.
- h - height in pixels for chart to be rendered. For both w and h divide the number of pixels by 300 to get the size in inches as it appears in the Word document.
- theme - path to a Report Style object for changing chart appearance.
- using - can be the name of a using that has been previously defined
<<chart report='Services\NeoPoint\NeoMobile for NeoPoint\Prices\Regions Prices' , instances=NSW1,from ='2010-01-01' ,period=ThreeDays, w=1900, h=1250>>Example below shows on how to include a chart with a particular theme
<<chart report='Australia\MMS R6\Dispatch\1 Price, Demand, Flows\5 InterconnectorFlows\Interconn Flow, Limits, Constraints 5min' , instances='N-Q-MNSP1' ,from='2015-01-01' ,period=ThreeDays, w=1900, h=1250, theme='NEO Themes\Web - Dark'>>
'Table' command
The following are additional table commands:
- using - can be the name of a using that has been previously defined
- style – this is the name of a Word style
<<using name='RegionDemandReport' , report='Australia\MMS R6\Dispatch\1 Price, Demand, Flows\2 Demand\1_Region\Region Demand ALL 30min' ,from='2010-01-01' ,period=Daily>>

<<table using=RegionDemandReport ,s=0>>
'Add to Table' command
The following are additional addtotable commands:
- using - can be the name of a using that has been previously defined
<<using name='RegionDemandReport' , report='Australia\MMS R6\Dispatch\1 Price, Demand, Flows\2 Demand\1_Region\Region Demand ALL 30min' ,from='2010-01-01' ,period=Daily>>

<<addtotable using=RegionDemandReport ,s=0>>
| Date time | Demand 30 min |
|---|---|
| --- | --- |
'Using' command
The following are additional using commands:
- name - defines the name under which the report results can be stored. This name can then be used in any chart, table or value command to retrieve those results
<<using name='RegionDemandReport' , report='Australia\MMS R6\Dispatch\1 Price, Demand, Flows\2 Demand\1_Region\Region Demand ALL 30min' ,from='2010-01-01' ,period=Daily>>
'Value' command
The following are additional value commands:
- using - can be the name of a using that has been previously defined
- s – section can be index or name of section
- c – column can be index or name of column
- r – row in column
<<using name='RegionDemandReport' , report='Australia\MMS R6\Dispatch\1 Price, Demand, Flows\2 Demand\1_Region\Region Demand ALL 30min' ,from='2010-01-01' ,period=Daily>>

<<value using=RegionDemandReport, s=0,c =1,r =0>>
Download the sample template and the output word document from below:
Download sample template Download sample reportIES provides powerful online tools for electricity and gas market data analysis, visualisation and simulation.
+61 2 9436 2555info@iesys.com
www.iesys.com
DATA ANALYSIS
Products / Services
MARKET MODELLING
Product and features
© 2025 Intelligent Energy Systems. All Rights Reserved. | Privacy Policy