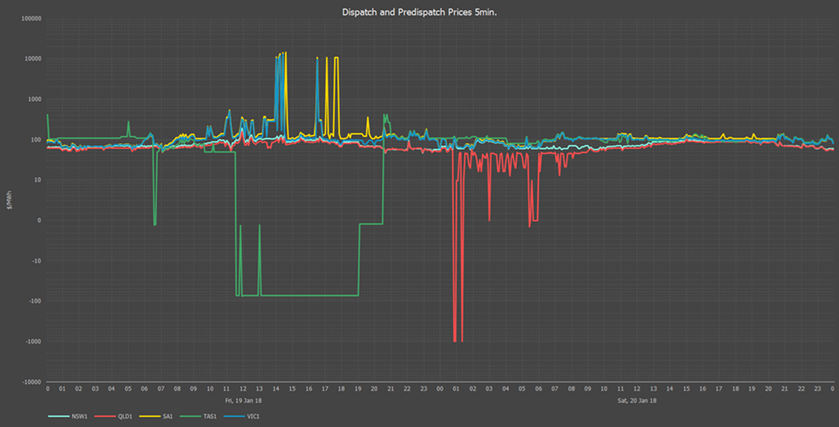
Improved log scale
With NEM prices ranging from -1000 to $14,200 $/MWh its useful to plot on a log scale but of course log scales in this case provide unnecessary detail below 10 $/MWh and negative values can’t be plotted.
The solution we’ve come up with is a “bilog” scale which is linear in the range +e to –e, log10(x) > e and -log10(-x) < -e.
The choice of e means a plotted curve remains smooth and continuous. Below is a recent chart that shows a bilog chart of NEM prices.
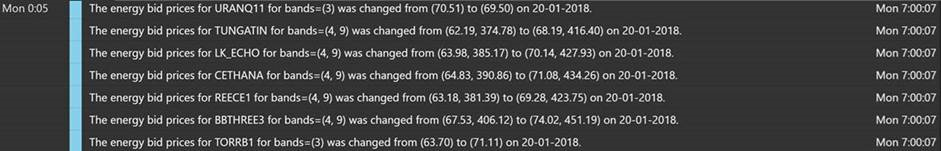
Bid Price Changes
We have added an additional market event which is Bid price changes.
These market events are generated by our systems at 7am every morning so you might not see them unless you scroll down the market events.
Because we can only see bids from the previous trading day and they could only havebeen changed on the trading before that the message date is two days behind the current trading date.
This market event is useful for traders interested in “shadow bidding” and related activities.
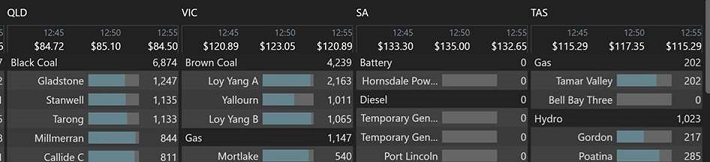
Aggregate generation by fuel type
On the Overview, Live Generation tab we are now also showing the aggregate generation for each fuel type.
IES provides powerful online tools for electricity and gas market data analysis, visualisation and simulation.
+61 2 9436 2555info@iesys.com
www.iesys.com
DATA ANALYSIS
Products / Services
MARKET MODELLING
Product and features
© 2025 Intelligent Energy Systems. All Rights Reserved. | Privacy Policy