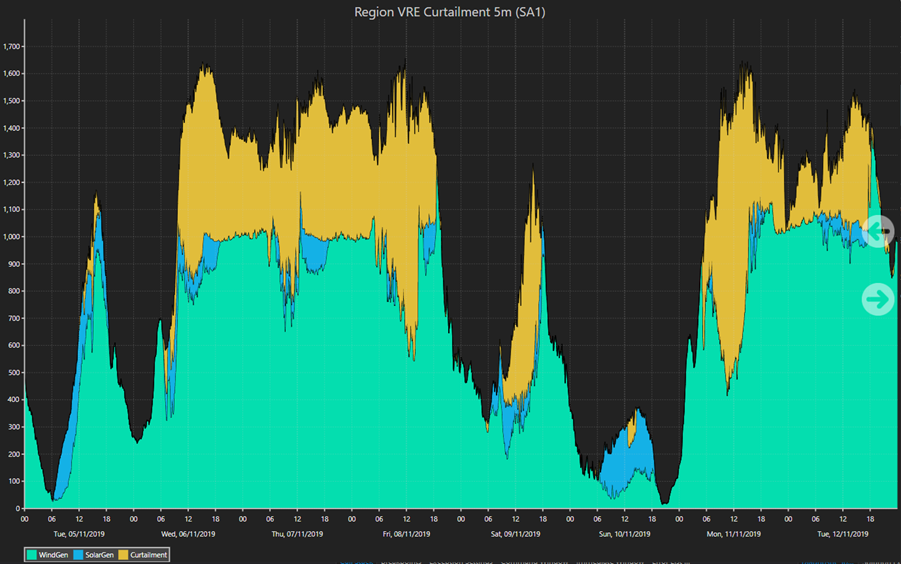
VRE Curtailment
We have added new reports to NEOmobile which would allow users to visualise the reduction in solar and wind output as a result of AEMO curtailing certain variable renewable generators to maintain a secure power system. You can find these reports from the All Reports page and selecting Renewables in the drop-down menu. The reports come in 2 resolutions: a daily chart for visualising long-term trends and a 5-minute chart for visualising short-term trends.
Raise FCAS Cost Recovery
We have also included reports on Raise FCAS cost recovery from NEM participants. The cost of procuring Raise contingency services in the NEM is recovered from market generators (scheduled/semi-scheduled/non-scheduled). The amount recovered can be visualised at 5m resolution from these new reports. They can be found in the All Reports page and selecting FCAS in the drop-down menu. Recovered amounts can be visualised at a region level or at a portfolio level.
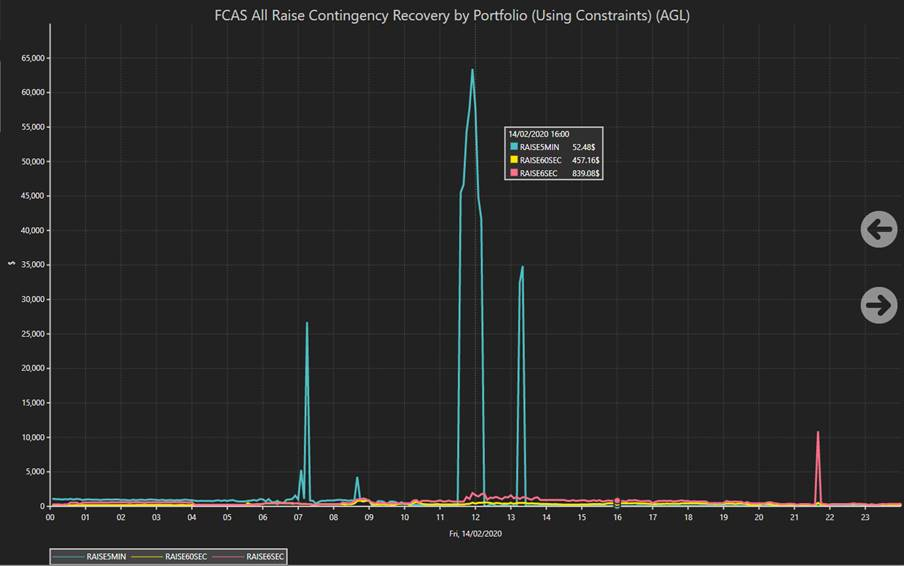
The costs of Lower services are recovered from Market Customers; similar reports for lower will be created at a later date.
More information about the FCAS recovery process can be obtained from relevant documents produced by AEMO. The crucial feature of the FCAS Recovery procedure is that money for the FCAS service is recovered from the region where the service was required. For example, consider a situation where there is a risk of a generator in South Australia or the line it is connected to being tripped; if the trip occurs there would be a shortfall of generation in SA1. To cover this shortfall, NEMDE will procure more RAISE service from units in SA. The money to cover the enablement costs of these units would be recovered from market generators within SA. Local requirements are formulated in NEMDE as constraints and they can be understood in more detail from the NEOmobile constraint view or other charts described below. Local requirements in SA just like the ones described here ( F_S+SNS_TG_R6_1, F_S++TIB3_R6_1, F_S++TIB4_R6_1, F_S++OSB_R6_1, F_S+PPT_R6_1) created opportunities for high FCAS Raise prices in SA in November 2019 (See figure below).
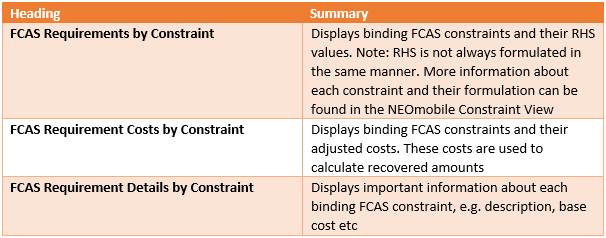
More information about FCAS requirements can be obtained from the relevant requirement reports in the same FCAS section. More information on each heading is provided below.
A sample chart of requirements and price is shown below. This covers a 2-day period in November 2019 when SA1 experienced high FCAS Raise prices as a result of a significant generation risk.
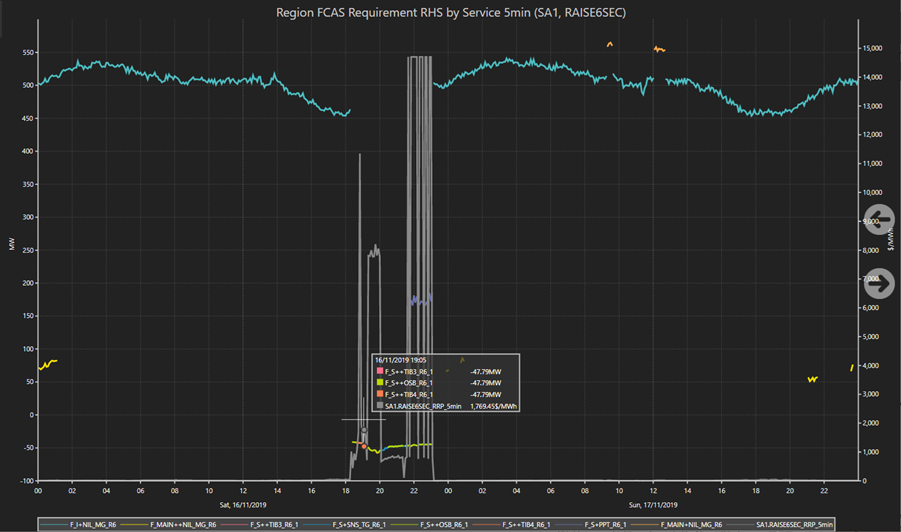
Chart Data Tips
A couple of weeks ago we changed all of our charts to use data tips. Also the region panels in the Overview pages, when clicked, now go to a popup chart, i.e. they don’t leave the page. This is to reduce “click fatigue” caused by the lag of leaving then having to return to a page. Please note that at the top of the popup is an arrow icon which when clicked will go to the original page, in this case the Region Snapshot page.
Constraint View
The Constraint view has been redesigned with a slightly easier to understand colour scheme. Also the RHS sub sections and Equation sub sections are now collapsible.
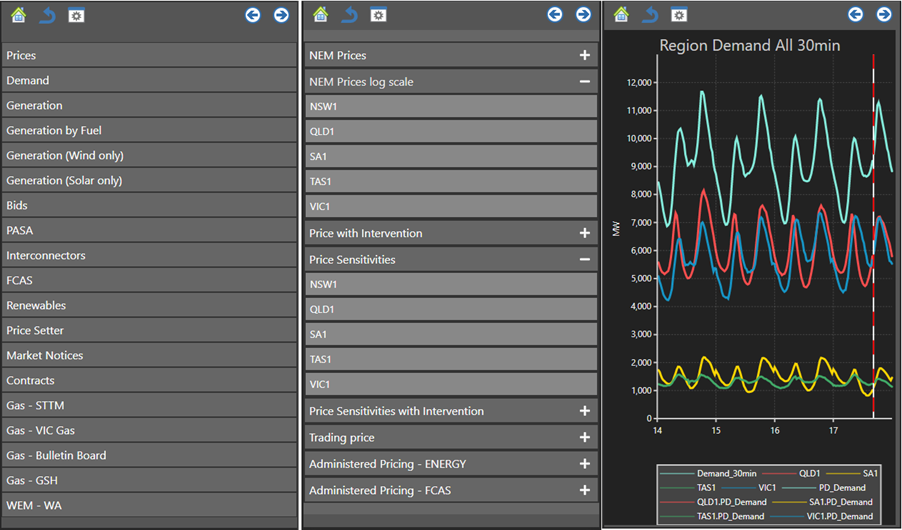
All Reports Mobile View
The All Reports view has been redesigned to work better with mobile phones. The page now has four panes – the user only sees one pane at a time. The top level tab, which is the left most, lets the user select what group of reports to look at, e.g. Price, Demand, Bids etc. When the user clicks on a group, the second pane is shown, which is the reports with that group. Clicking on a report then shows the chart. Clicking on the “gear” icon brings up the fourth pane which allows changing the date or period or selecting table or chart.
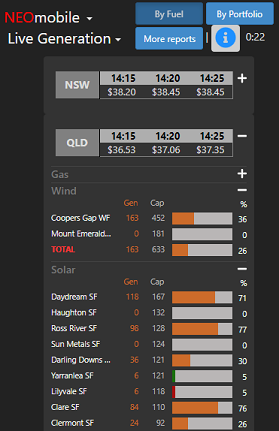
Live Generation by Fuel or Portfolio
We have changed the Live Generation by Fuel to optionally group by Portfolio. The selector for fuel or portfolio is at the top of the page.
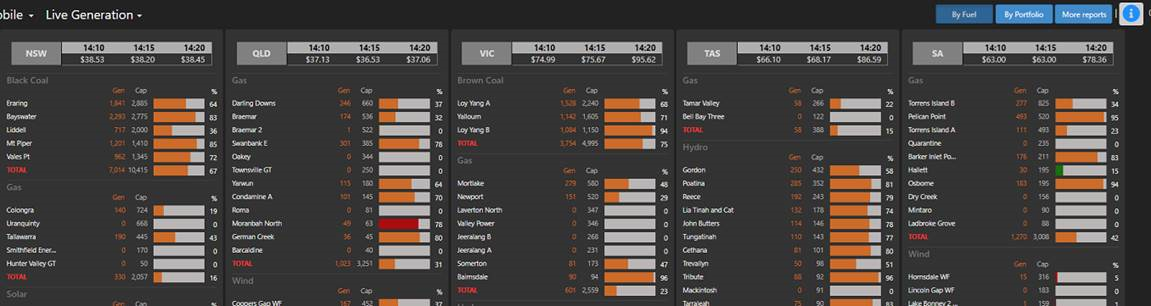
LiveGeneration has also been redesigned to be responsive for mobile phones and to make it easier to navigate, each state is collapsible as shown below.
IES provides powerful online tools for electricity and gas market data analysis, visualisation and simulation.
+61 2 9436 2555info@iesys.com
www.iesys.com
DATA ANALYSIS
Products / Services
MARKET MODELLING
Product and features
© 2025 Intelligent Energy Systems. All Rights Reserved. | Privacy Policy